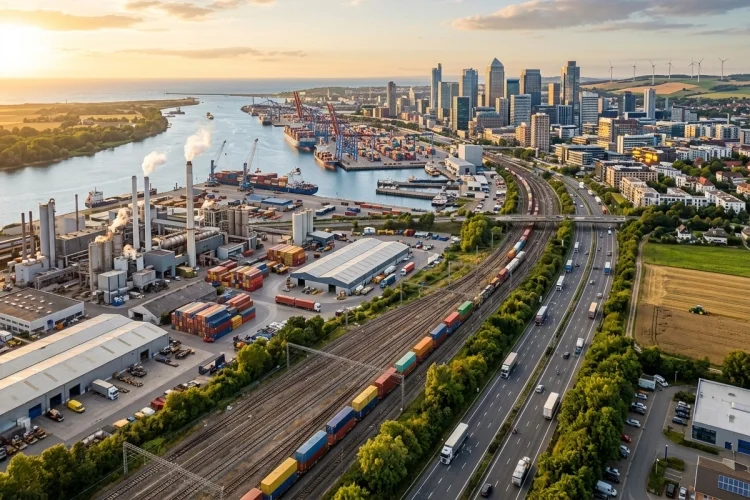
When people say that an economy is growing, shrinking, or heading towards a recession, they are usually talking about one important number: Gross Domestic Product, better known as GDP.
GDP appears regularly in business news, government reports, and political debates. It can influence interest-rate decisions, business investment, public spending, and financial-market expectations. Yet the term often sounds more complicated than it really is.
So, what is Gross Domestic Product? In simple terms, GDP measures the monetary value of final goods and services produced within a country during a specific period. It gives economists a broad picture of how much economic activity is taking place.
However, GDP is not a complete measure of national success. It tells us a great deal about production, but much less about happiness, inequality, environmental quality, or how income is distributed.
This guide explains how GDP works, how it is calculated, why real GDP differs from nominal GDP, and how to interpret the number more carefully.
What Does Gross Domestic Product Measure?
Gross Domestic Product measures the value of final goods and services produced within a country’s borders over a particular period, usually a quarter or a year.
The word gross means the calculation does not subtract the depreciation of buildings, machinery, vehicles, and other productive assets. Domestic means the production must take place inside the country, regardless of who owns the company producing it.
For example, cars made by a foreign-owned factory inside Indonesia would contribute to Indonesia’s GDP. However, products made by an Indonesian-owned company in another country would normally contribute to the GDP of the country where production occurred.
GDP includes private-sector activity and government production. It covers physical goods such as food, furniture, and vehicles, as well as services including healthcare, education, banking, transport, and entertainment.
How Is GDP Calculated?
Economists can calculate GDP using three main approaches: expenditure, income, and production. In theory, each method should produce approximately the same result because spending on production becomes income for someone else.
1. The Expenditure Approach
The expenditure approach is probably the most familiar method. It adds spending by households, businesses, governments, and foreign buyers.
The basic formula is:
GDP = C + I + G + (X − M)
In this formula, C represents consumer spending, I is business investment, G is government spending, X represents exports, and M represents imports.
Consumer spending includes purchases such as groceries, clothing, rent, transport, and entertainment. Investment covers business equipment, factories, software, new housing construction, and changes in inventories.
Government spending includes public services, infrastructure, defence, and government investment. Exports are added because they are produced domestically, while imports are subtracted because they were produced in another economy.
2. The Income and Production Approaches
The income approach adds the income generated through production. This includes employee compensation, business profits, rental income, and taxes on production, with relevant adjustments.
The production approach calculates the value added by businesses and government organisations. Value added is the value of output minus the value of intermediate goods and services used to create it.
For example, a bakery may sell bread for $5 but use $2 worth of flour, electricity, and other inputs. Its value added would be $3. This method prevents the same production from being counted repeatedly.
Why GDP Counts Only Final Goods and Services
GDP includes final products rather than every transaction that occurs during production. Otherwise, the same economic activity would be counted more than once.
Imagine that a farmer sells wheat to a mill for $1. The mill turns it into flour and sells it to a bakery for $2. The bakery then sells bread to a customer for $4.
Adding every sale would produce a total of $7, even though the final bread is worth only $4. GDP avoids this problem by counting the final product or, alternatively, the value added at each stage.
Used goods are generally excluded because their production was counted when they were originally made. Selling a second-hand car does not represent new production, although fees paid to a dealer or online platform may count as newly provided services.
Financial transactions such as purchasing shares are also not directly included because they involve the exchange of existing financial assets. However, brokerage and management fees may contribute to GDP because they pay for current services.
Nominal GDP vs Real GDP
Nominal GDP measures economic output using current market prices. This means it can rise because a country produces more goods and services, because prices increase, or because both happen at the same time.
Suppose an economy produces 1,000 bicycles at $200 each in one year. Its bicycle output is worth $200,000. The following year, it still produces 1,000 bicycles, but the price rises to $220. Nominal output increases to $220,000 even though the number of bicycles has not changed.
Real GDP adjusts for changes in prices. It uses constant prices to measure changes in the actual volume of production.
This makes real GDP more useful when economists want to know whether an economy is genuinely producing more. Nominal GDP is still useful for measuring the current monetary size of an economy, tax bases, debt ratios, and financial flows.
GDP Growth and GDP Per Capita
The GDP growth rate shows how much economic output has increased or decreased compared with an earlier period.
Positive real GDP growth usually means the economy is producing more goods and services. Negative growth means output has declined. A long period of weak or falling production may be associated with lower business confidence, reduced investment, and weaker job creation.
GDP per capita is calculated by dividing total GDP by the population. It provides a rough estimate of average economic output per person.
This measure is useful when comparing economies of different sizes. A large country may have a huge total GDP simply because it has a large population, while a smaller country could have much higher GDP per person.
However, GDP per capita is only an average. It does not show how income or wealth is distributed. Two countries with similar GDP per capita can have very different levels of inequality and living standards.
Why GDP Matters
GDP helps governments, businesses, investors, and central banks understand the general direction of the economy.
A growing economy may encourage companies to expand, hire workers, or invest in new equipment. Falling output may cause businesses to delay projects, reduce inventories, or limit recruitment.
Governments use GDP data when planning budgets and evaluating tax revenue, public debt, and spending programmes. Debt and budget deficits are often presented as percentages of GDP because this compares them with the size of the economy.
Central banks also examine economic growth alongside inflation, employment, wages, and financial conditions. Strong demand and rapid growth may contribute to inflationary pressure, while weak output can signal that households and businesses are reducing spending.
GDP data also make international comparisons possible. Organisations such as the World Bank, IMF, and OECD use national accounts to analyse economic performance across countries.
What GDP Does Not Measure Well
GDP is a powerful economic indicator, but it should not be treated as a complete scorecard for society.
It does not directly measure happiness, life satisfaction, safety, leisure time, or the quality of personal relationships. It may increase after costly events such as natural disasters because rebuilding creates economic activity, even though the disaster has damaged people’s lives.
Unpaid work is another limitation. Cooking at home, caring for children, and looking after elderly relatives create real value, but they are generally not included when no market payment occurs.
GDP also says little about income distribution. Economic output can grow while much of the additional income goes to a relatively small part of the population.
Environmental damage may also be poorly reflected. Production that causes pollution can add to GDP, while the loss of forests, clean air, or natural resources may not be fully deducted from the headline figure.
The OECD therefore notes that GDP is important for measuring economic activity but is not, by itself, a suitable measure of people’s overall material well-being.
How to Read GDP News More Carefully
When you see a GDP headline, first check whether it refers to nominal or real GDP. Real GDP is usually more helpful for evaluating changes in production because it removes the effect of inflation.
You should also check the comparison period. A report may compare one quarter with the previous quarter, the same quarter one year earlier, or the entire year with the previous year.
Look beyond the headline growth rate to see which components changed. Growth driven by household consumption may have different implications from growth caused mainly by government spending, exports, or business inventories.
GDP figures can also be revised as statistical agencies receive more complete information. An early estimate should therefore be treated as a useful but incomplete picture rather than a final number.
Finally, combine GDP with other indicators. Employment, real household income, productivity, inflation, inequality, health, and environmental data can provide a fuller understanding of economic and social conditions.
Gross Domestic Product measures the monetary value of final goods and services produced within a country during a specific period. It can be calculated through spending, income, or value added, and it remains one of the most widely used indicators of economic activity.
Real GDP helps reveal changes in production after adjusting for inflation, while GDP per capita makes comparisons between differently sized populations easier.
Still, GDP cannot fully describe quality of life, inequality, unpaid work, or environmental sustainability. The next time you encounter a GDP report, look beyond whether the number rose or fell.
Check what caused the change, whether the figure is adjusted for inflation, and what other economic indicators reveal about people’s actual living conditions.